Continuous Quality Improvement
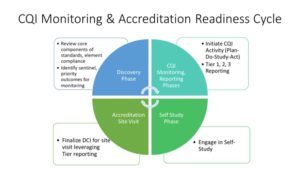
In order to foster a culture of continuous quality improvement (CQI) and ensure ongoing accreditation readiness, UWSOM implemented the CQI Policy, Procedures and Guidelines. Through regular CQI monitoring, EQI closely partners across the school to ensure the education program fulfills its mission, strategic priorities and maintains accreditation compliance.

The EQI Office provides regular data analysis and reporting to help drive improvement across Academic, Rural and Regional Affairs. Recent reports include:
2023 Reports:
- 2023 Student Data Summary Report
- 2023 Student Survey Questions
- 2023 Association of American Medical Colleges (AAMC) Graduation Questionnaire (GQ) Summary Report
2022 Reports:
When you plan CQI initiatives, consider following categories to improve your services: Governance Structure, Policies & Procedures, Personnel (ex. Fill vacancies), Central Monitoring System, Resources, or Communication Plan
Tools for CQI
Plan-Do-Study-Act (PDSA) is one of popular CQI tools. You can also consider a cause-and-effect diagram (also known as a Fishbone diagram) to brainstorm possible causes for an effect or problem. A driver diagram can be used to identify the relationship between overall aim of the CQI initiatives (primary and secondary drivers) and specific change ideas.
PLAN-DO-STUDY-ACT (PDSA)
PDSA is an iterative and four-step problem-solving tool used for improving various aspects of the educational program, such as governance, policies, personnel, and resource allocation, while continuously monitoring progress and making data-driven adjustments to achieve your defined goals and outcomes. Utilizing this tool, we focus on the following questions*:
- What are we trying to accomplish or change? *
- How will we know that a change is an improvement? *
- What changes can we make that will result in improvement? *
- What systems or processes of communication will you use to share progress or results of the implementation with students?
(* from The Improvement Guide (Langley GJ, Nolan KM, Nolan TW, Norman CL, Provost FP, San Francisco, California: Jossey-Bass Publishers, Inc.:2009)
You can use the following template: CQI_ PDSA Working Document
CAUSE & EFFECT DIAGRAM (Fishbone Diagram)
A Cause-and-Effect Diagram, also known as a Fishbone Diagram or an Ishikawa Diagram, is a visual tool used in Continuous Quality Improvement (CQI) to identify and analyze the possible causes of a specific problem or issue. The diagram helps teams brainstorm and categorize potential causes to better understand the root causes of a problem.
You can use the following template: CAUSE & EFFECT DIAGRAM (Fishbone Diagram)
DRIVER DIAGRAM
With this tool, your team can outline the key components, relationships, and drivers that contribute to achieving a specific quality improvement goal. It is a structured approach to understand the cause-and-effect relationships within a complex process or system.
You can use the following template: Driver Diagram
Looking for Data? Consider the Following Data Sources.
EQI identified a range of data sources, both internal and external, to inform the PDSA cycle. This includes survey data, evaluations, student performance data, and external sources like policies and procedures.
- Internal Data
- End-of-Phase Surveys (Conducted in March to June 2023)
- Evaluation related data
- End of Block evaluations
- End of Clerkship evaluations
- Student performance data
- Grades submission (ALT)
- Test Scores (such as USMLE)
- External Data
- Graduation Questionnaire by Association of American Medical Colleges
- Policies and Procedures
- UWSOM Medical Education Program Policies (MD Program Handbook)
- Curriculum Governance Minutes
- Additional student input beyond data (qualitative data including comments)
Please refer to our newly created CQI Spotlight corner for more examples for continuous quality improvements! https://education.uwmedicine.org/eqi/cqi-spotlight-we-heard-you/
